
2025/08/29 - Vasilije Markovic
DuckDB × cognee: Run SQL Analytics Right Beside Your Graph-Native RAG
SQL analytics and graph-native retrieval together, eliminating the trade-off between fast analytics and one-off RAG retrievals.
- 4 min read
BY- 4 min read
BYFrom urban planning to climate analysis, real estate analytics to logistics, site selection to advertising — geospatial data is everywhere. But working with it has traditionally been hard:
Whether you're a developer building spatial analytics or a business user exploring location-based trends, it's often a struggle when you need to get and share insights out of a geospatial dataset.
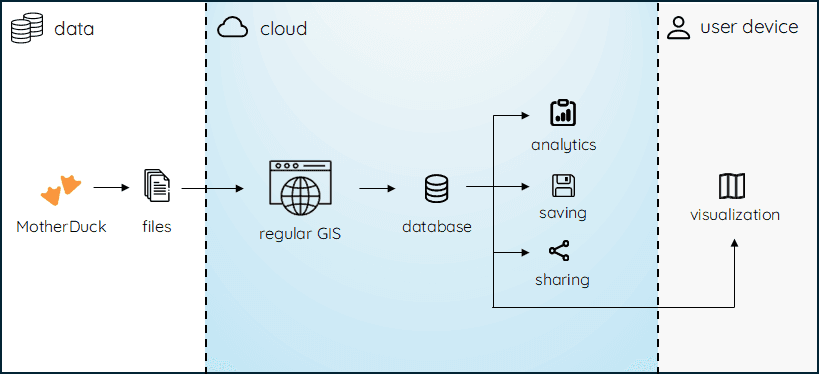
Traditionally, geospatial analysis meant spinning up a dedicated infrastructure: PostGIS databases, servers and scripts for data conversion. With DuckDB spatial extension, your device alone becomes a powerful spatial tool.
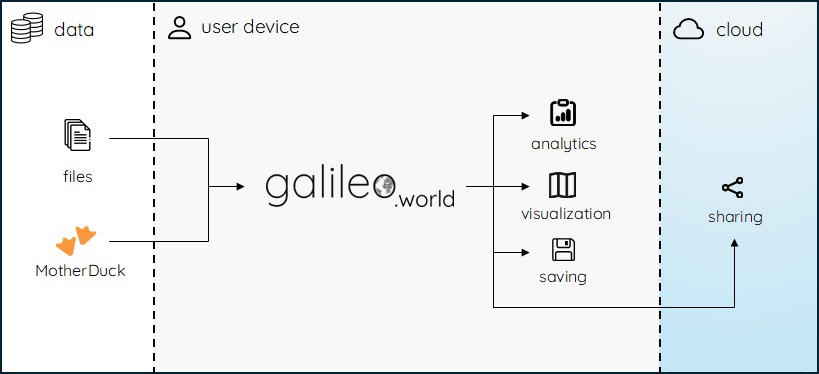
Galileo.world takes advantage of DuckDB-Wasm’s capabilities of running queries directly in the browser and MotherDuck’s infrastructure to leverage performance for bigger datasets. Its technology is mostly based on these foundations:
Therefore, most of the action occurs in your browser, which results not only in performance, but also privacy, since files and maps do not leave it, unless you decide to share them.
How regular GIS works:
How galileo.world works:
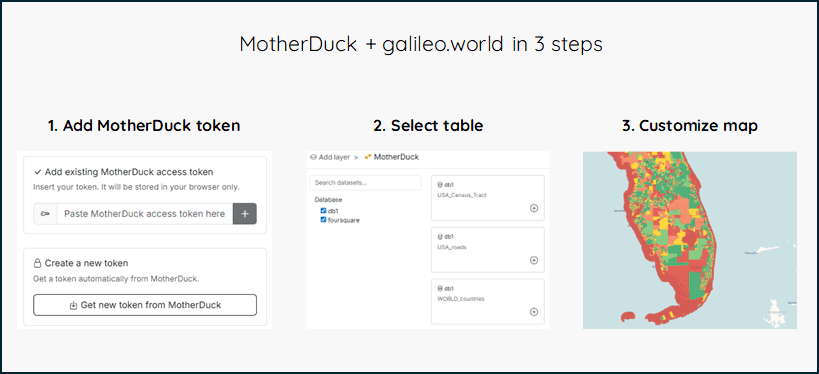
Galileo.world’s key features:
When working with geospatial data, two things kill performance: high amount of and high complexity of geometries. It’s common to see the following issues related to them:
In practice, raw plotting of big datasets creates significant bottlenecks for real-time interactivity, turning exploration and analysis into a struggle.
The most common strategy for this case scenario is create tiles. A tile is simply a small piece of a bigger dataset, divided by predefined grids at each zoom level. Each tile contains a limited number of geometries and edges, usually defined when you create it. That limitation allows tiles to render faster while still visually convincing for bigger datasets.
Even though tiles work very well for visualization, they are not designed for analytical purposes, since they do not necessarily contain all the data from the original dataset. Therefore, performing calculations over tiles can provide misleading results due to incomplete data.
A more comprehensive guide to tiling can be found here.
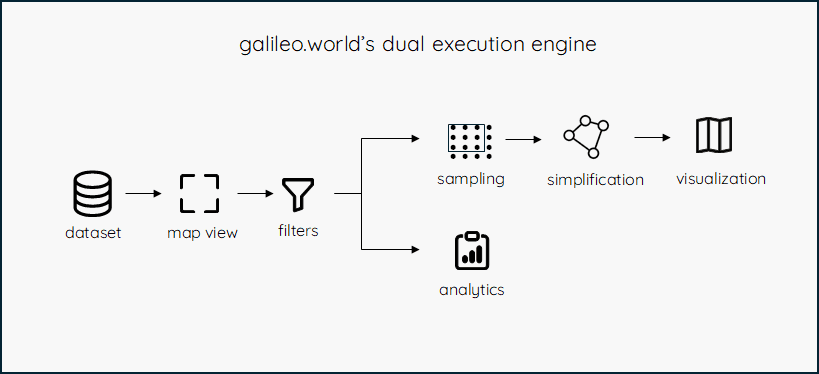
In order to display big datasets and still maintain analytical fidelity to the original data, galileo.world adopts a dual execution engine. Taking advantage of DuckDB-Wasm and MotherDuck full capabilities, the app operates with multiple workers, orchestrating queries that’ll plot geometries on the map and those that will provide analytical outputs such as charts.
For visualization, the dataset goes through sampling and geometry simplification, which virtually eliminates any dataset size limitations and increases performance while dynamically zooming or panning.
For analytics, not only the data displayed on the map is used, but the entire original dataset, hence preventing misleading calculations and missing data.
Whether working with big or small geospatial data, the combination of MotherDuck and galileo.world is a powerful duo to make your data analysis, visualization and project sharing faster, simpler and more secure. Try it here to see what’s possible and join galileo.world’s slack community.
2025/08/29 - Vasilije Markovic
SQL analytics and graph-native retrieval together, eliminating the trade-off between fast analytics and one-off RAG retrievals.

2025/09/03 - Jacob Matson, Jelte Fennema-Nio
PostgreSQL gets a DuckDB-flavored power-up for faster analytical queries without ever leaving Postgres.