← Browse Dives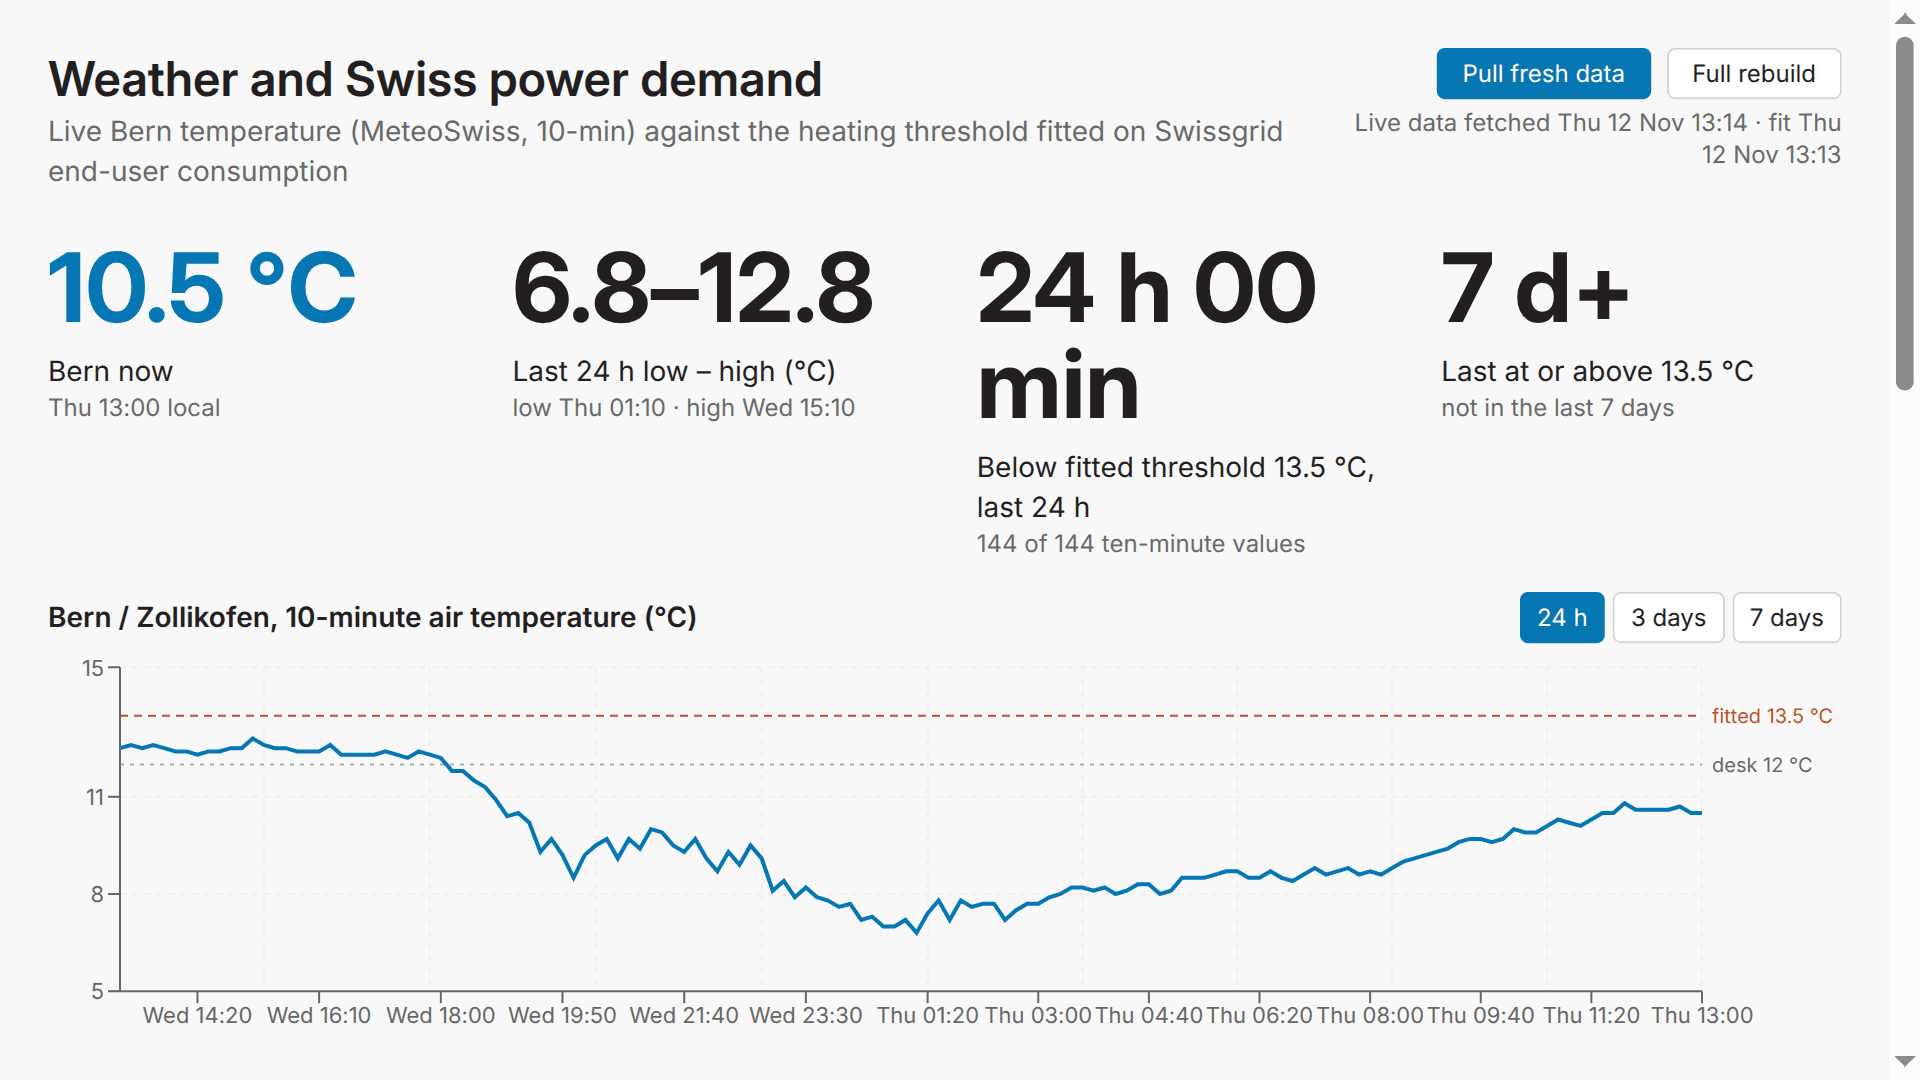
Loading Interactive Dive...
Trading desk: weather and Swiss power demand
Live Bern 10-minute temperature vs the fitted heating threshold, daily consumption-vs-temperature chart with the hinge fit, and the consumption-weighted station map. Refreshed by Flight swiss-heating-threshold.
DashboardWeatherEnergy
Author: Simon · November 12, 2026 Region: us-east-1
AI Prompts Used
1Prompt 1
I'd like to **understand how strongly temperature drives Swiss electricity consumption this year**.
I have two data sources. Swissgrid publishes the "Energieübersicht Schweiz" as an Excel file every month, you'll find it here: https://www.swissgrid.ch/dam/jcr:805e525c-44fe-4701-a227-6144193257ac/EnergieUebersichtCH-2026.xlsx. The sheet "Zeitreihen0h15" contains 15-minute values in kWh. The column I care about is "Summe endverbrauchte Energie Regelblock Schweiz" (end-user consumption), not total consumption, because the total includes pump storage and grid losses. The sheet also has consumption per canton further to the right, but note that Swissgrid groups some cantons together, for example BE with JU and ZH with SH.

For the weather, MeteoSwiss publishes all its automatic stations as open data here: https://data.geo.admin.ch/browser/index.html#/collections/ch.meteoschweiz.ogd-smn. Every station has a folder with daily, hourly and 10-minute files. The daily files are what I need. The parameter for daily mean air temperature at 2 metres is called tre200d0. There's a station list with coordinates and canton in ogd-smn_meta_stations.csv.

Please start with Bern (station BER) as a proxy for the Swiss Plateau. Give me the daily end-user consumption against the daily mean temperature for 2026 so far, and tell me from which temperature downwards consumption starts rising. In our industry we call that the heating threshold, we usually assume around 12 °C. I want to see if that still holds.

Also tell me if anything in the data looks off before you trust it.
2Prompt 2
You suggested a weighted temperature across stations instead of Bern only. Agreed. Use one representative station per canton, weight each canton by its share of consumption in the Swissgrid canton columns, and skip stations above 1500 m, nobody heats a home up there. Then show me the stations on a map of Switzerland with the canton outlines, coloured by this year's mean temperature. Canton outlines you can take from here: https://raw.githubusercontent.com/codeforgermany/click_that_hood/main/public/data/switzerland.geojson

Note: the outlines are rough, trust the canton column in the station list.
3Prompt 3
What's Bern doing right now, has it dropped below 13 °C in the last 24 hours? I want the 10-minute values, not daily averages.

Then put everything into one dashboard for the trading desk: the threshold chart, the map, and the live Bern temperature at the top. Add a button that pulls fresh data, and make it update itself every morning at 7 before the desk opens.
Comments
Log in to leave a comment.
No comments yet. Be the first!